How I Wrote This Blog
The Journey:§
I'd gotten the itch to write stuff of my own sometime last year after reading way too many technical blogs for "fun and profit".
One of said blogs was cuervo's blog, which I really liked - their theme felt easy on the eyes. Their website also included a RSS feed, which I loved. (Since I use RSS with Thunderbird to keep up with blogs)
The first step was getting acquainted with the SSG (Static Site Generator)1 of my choice, Zola. I picked Zola for two reasons: the theme I liked (cuervo's blog) was a Zola theme, and Zola was written in Rust. (Being written Rust was an advantage because I was reasonably proficient in Rust and could modify the codebase if push came to shove)
It turned out that the theme cuervo's blog used ("zerm") was a fork of the actual zerm theme, which in turn was a port of Radek Kozieł's Terminal theme for Hugo.
After going through Zola's documentation, I forked curveo (a.k.a PabloMansanet)'s theme and got to work.
Teething Troubles§
I distinctly remembered reading about $\KaTeX$ support in the README of the theme, and loved how it looked. However, on uncommenting the flag in my config.toml, nothing happened. This took me some time to pin down, but it turned out that I had somehow taken config.toml from the original zerm repository, while using the zerm fork. $\KaTeX$ support was merged in later, once the repository had already been forked. 🤦♂️ I got it working once I synced with the original repository.
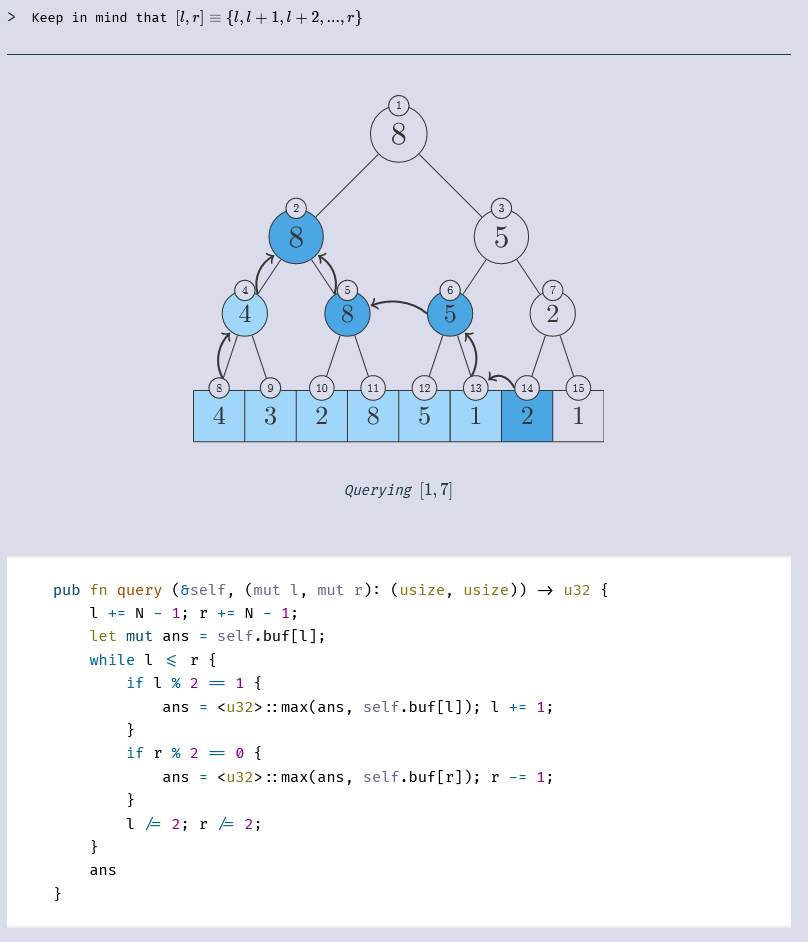
Next, diagrams. I had seen some of the (frankly gorgeous) diagrams in Competitive Programmer's Handbook and wanted something similar. Luckily, the book's source was available over at GitHub. The book used $\LaTeX$ (a typesetting language) with the pgf/Tikz library for illustrations. ($\LaTeX$ is what $\KaTeX$ is a subset of, and despite the similar names, the former is by far larger)
To my own surprise, I had MikTex (a latex distribution) along with TeXworks (a latex IDE) installed on Windows. It seems that past me had at once point set all this up and never done anything with it.
After copy-pasting a diagram into TeXworks, I was rather surprised - it worked perfectly. Which basically never happens. I quickly noticed that it was currently producing a full page pdf, which was not something I wanted, and thus all was right with world.
Descent into Madness§
I wanted to achieve complete automation of my build process - so I started writing shell scripts to do all the hard work for me. Along the way, I committed multiple war crimes.
Note: The term "War Crime" is used in further sections to humorously highlight bad practices.
War crime One§
I couldn't get LaTeX working on WSL. Everytime I ran the install script for tex-live I would miss something in the configuration. The first time, I included everything and set it to install, only noting later that the entirety of Tex-Live seemed to be 7 GB in size.
The next time, latex didn't install. tex and its many many cousins installed, but no mention of latex.
One more try; this time, nothing worked. I was fed up, and committed "war-crime" one:
which was calling latex from windows in WSL.
Now I had a way to produce a PDF from my .tex files.
The original LaTeX code had lots hard-coded coordinates which I didn't like, since I felt that they made the overall diagram difficult to parse. Something like:
\begin{center}
\begin{tikzpicture}
\draw (0,0) grid (8,1);
\node at (0.5,0.5) ;
\node at (1.5,0.5) ;
\node at (2.5,0.5) ;
\node at (3.5,0.5) ;
\node at (4.5,0.5) ;
\node at (5.5,0.5) ;
\node at (6.5,0.5) ;
\node at (7.5,0.5) ;
\footnotesize
\node at (0.5,1.4) ;
\node at (1.5,1.4) ;
\node at (2.5,1.4) ;
\node at (3.5,1.4) ;
\node at (4.5,1.4) ;
\node at (5.5,1.4) ;
\node at (6.5,1.4) ;
\node at (7.5,1.4) ;
\end{tikzpicture}
\end{center}
After reading the entire chapter on the Tikz Mathematical Engine in the Tikz guide three times (and many StackOverflow answers), I managed to get a counting loop working.
\begin{center}
\tikz[scale=0.7, frontmatter]
\end{center}
\end{document}
There are two really nice things about latex:
(1) the "ecosystem" has had time to develop, and there is no lack of resources for troubleshooting highly-specific problems.
(2) the documentation for everything is super pretty.
My next endeavor was getting latex to produce .svg files - they would be perfect for scalability. I recalled seeing svgs which could adjust their color based on browser theme to adapt their colors, which sounded great, considering that the current output of pdflatex in PDF viewers was near invisible, since I was building my diagrams for a website with a dark background, while the PDF had a white background.
I quickly found dvisvgm.exe for the task, and after some minor teething troubles (which was a constant in my life by that point), got it running.
War crime Two§
Once I had a .svg file to embed in my web page, I tried to get it to size properly. The output looked ridiculously small on my desktop monitor.
dvisvgm.exe produces output along the lines of:
1
2 <!-- This file was generated by dvisvgm 2.11.1 -->
3
4
5 6 7
8
9
10
11
12 4
13
14
15
I identified that <svg> wouldn't inherit any sizing until I deleted the width and height attributes included in the third line. I'll be the first to admit that I really don't have experience with the front-end.
So... war crime.
The above snippet looks at line number 3, and substitutes the text matching the patterns
width='[^']*'andheight='[^']*'with nothing. This sed invocation will transformwidth='foo' irrelevant info='bar' height='qux'(at line 3) toirrelevant info='bar'.
Sizing works now! I even got an easily-controllable size slider in the form of width = x% with CSS.
War crime Three§
This one has a bit of a story behind it. See, the LaTeX library I was using didn't have something similar to an erase option. I drew my indices on top of existing markings, so they overlapped like so:
After searching far and wide (even looking at the updated 1321 page Tikz manual), I came to the conclusion that there was no way to "erase" an area. Sure, there for a few promising leads, but most led to hacks that would only work on specific PDF renderers, etc.
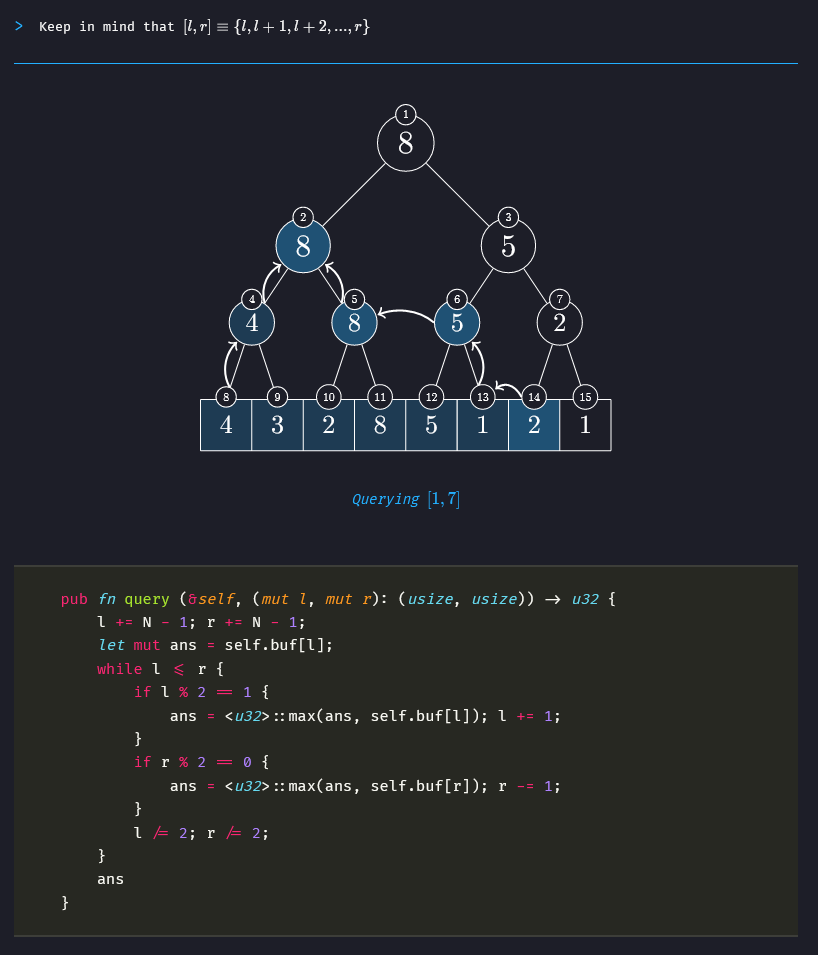
With a heavy heart, I set my index markings to color the area behind them with the background color. This would mean that my hope of easily getting SVGs to adapt to color modes (dark and light) was gone, since the SVG itself would include assumptions about the background color.
But! Another war crime later, I found I could have my cake and eat it too. Replace all hard coded colors in the SVG with CSS variables! This, incidentally, ensures that I can't wrap my <svg> in an <img> tag anymore.
Yes, I am aware of the quote:
Some people, when confronted with a problem, think “I know, I'll use regular expressions.” Now they have two problems. " -- Jamie Zawinski
After setting a few CSS variables, my diagrams now scaled with size and adapted to the color theme.
If you're feeling curious, this is what they look like on both light and dark mode.
Intermission: Checksum-based $\LaTeX$ build§
latex takes a few seconds to compile each TeX file, after which, dvisvgm.exe takes a few more. With the number of diagrams rising so quickly, it was beginning to take about ten seconds for all the diagrams to build. And since I'm a lazy person who doesn't like putting in the name of the diagram I want to build, I wrote a quick-and-dirty checksum-based build system using md5. (side-note: md5 is cryptographically unsound, do not use it for security purposes.)
for;
do
if || ! ; then
fi
done
md5sum -c "$file:r.checksum" < "$file"checks if the checksum of$filematches the checksum stored in$file:r.checksum. (md5man page)
The
$file:rsyntax in zsh removes the extension from the file path. (i.e.illustrations/array-diagram.texbecomesillustrations/array-diagram)2
(Canceled) War crime Four§
Next on my list was making sure that the code I wrote in my articles was well-tested and up-to-date. A bonus would be linking to the actual code file whenever I displayed a part of it in an article.
Zola has these things called shortcodes which can take parameters and insert HTML (for example image (src="", caption="", ...)) and call other special functions (such as load_data(), which loads in data from a file or URL)
I wanted to display relevant parts of my programs, so I needed to extract only those lines and display them. Unfortunately, Tera (the templating language Zola uses) was sorely not up to the task.
I got as far as properly extracting lines, but then I had to deal with removing extra indentation at the start of lines by a certain amount (i.e. delete n amount of tabs from the starting of each line.)
I gave up.
Instead, I built a web server in Python to serve file ranges and used something like load_data(url="localhost:8000/?file=illustrations;start=5;end=10") to get code snippets.
Then I dropped that because:
- it felt incredibly ugly. Just think about it. To build your website, you must:
- Run a script to build LaTeX files and then several sed invocations to get the svgs working.
- Launch a Python server to properly cut and serve code blocks.
- Run the actual site generator.
- it was likely that the caching zola did for URLs would interfere.
Could I have solved this problem? Yes. Did I want to? No, not really; the solution did not seem to warrant the cost. I settled for copy-pasting relevant code in articles. I'll probably do something about that in the future once it becomes enough of a problem.
Bonus problems§
-
(Solved) Generating social preview images (in compliance with the Open Graph Protocol) required me to also use ImageMagick and
pdflatex, sincedvipngmdid not work because of some Tikz problems. -
(Unsolved) Using a custom domain. The domain I had was bought from an incredibly unknown provider with a website that looked like it was straight from the 2000s. I still don't know why even after updating my DNS records that domain doesn't redirect.
-
(Solved) CSS. Everything new I tried - having line numbers in code blocks, getting code blocks to switch colors, etc. I had to adjust CSS every time.
Writing this article does give me ideas for more improvements to my build process.
- Integrating a spell-checker
- Code snipping with line numbers and reference to the actual file in the codeblock itself.
- Getting a custom domain
- Automating social media preview generation instead of having to manually adjust the coordinates for ImageMagick to make a photo from the pdf made from a TeX file.
Update from the future (2022-6-9): I'm using
aspellfor spell-checking for now.
Update from the future-future (2022-12-30): I have a custom domain now. The domain wasn't redirecting because it had the wrong NS servers.
Update from the futre-future-future (2023-1-21): I'm now custom building fonts from Google Fonts through FontForge. For some reason,
ttfisn't really working for me, so I'm converting fonts towoff2instead.
Retrospective§
I probably should have taken a step back from integrating LaTeX for diagrams and evaluated other tools. I only remembered recently that PlantUML, Mermaid and many others existed.
Further Reading/References/Footnotes§
While I would've loved to explain a lot of these on my own, unfortunately I lack the expertise necessary to speak much on these topics.
I'm looking for Summer 2025 internships. Feel free to write to me to point out an error, suggest a topic, or just say hi!